Companies and customers are in desperate search for workers. Before COVID 19, a booming economy pushed the United States to full employment and a lack of skilled workers was the number one issue facing corporate site location projects. During COVID 19, many companies and customers simply cannot find any workers—skilled or unskilled.
The labor force participation rate is a measure of an economy’s active workforce. The formula for the number is the sum of all workers who are employed or actively seeking employment divided by the total noninstitutionalized, civilian working-age population. The U.S. labor participation rate stood at 61.4% as of February 2021, according to the federal Bureau of Labor Statistics (BLS), which publishes updates monthly. The monthly figures have hovered around 63% since 2013, after a sharp decline in the wake of the Great Recession. Investopedia reports that, in August 2020, there were 13.6 million unemployed, up 7.6 million from the 6 million in August 2019.
A booming economy does not guarantee that more workers will be available to accommodate that growth. The U.S. Census Bureau recently reported, from January 2010 to December 2019, the Dow Jones Industrial Average and S&P 500 soared 173.60% and 189.35%, respectively, and the Gross Domestic Product increased from $14.992 trillion to $21.433 trillion. Yet, during that same period, the labor force participation rate actually declined. So, how could it drop when the economy was booming and labor force participation rates among the working-age population grew in every age category? The answer to this puzzle lies in a major demographic trend: the rise in the percentage of the population ages 65 and over. The oldest baby boomers were 64 in 2010 and 73 in 2019. As they aged, a large segment of the population shifted into 65 and older age groups. Because older Americans are less likely than younger ones to be in the labor force, this demographic shift reduced the overall labor force participation rate.
According to the U.S. Census Bureau, the national labor force participation rate for the total population ages 16 and over decreased from 64.4% in 2010 to 63.6% in 2019. Despite the overall dip, the labor force participation rate went up across all age groups from 2010 to 2019:
- Ages 16 to 19: 37.7% to 39.9%.
- Ages 20 to 64: 77.5% to 78.3%.
- Ages 65 to 74: 24.8% to 26.8%.
- Ages 75 and older: 5.7% to 7.2%.
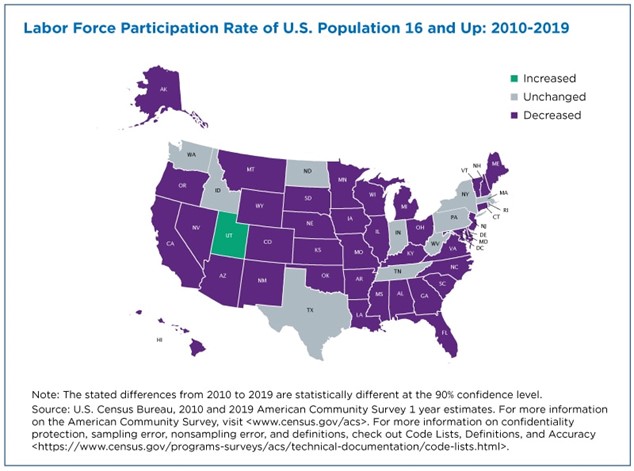
As the chart below illustrates, only one state (Utah) and the District of Columbia experienced increases in their labor force participation rates for the total working-age population ages 16 and older while 38 states experienced decreases.
However, just as it played out nationally, labor force participation rates went up in most states in every age group from 2010 to 2019:
- Ages 16 to 19, up in 26 states and D.C., and down in four.
- Ages 20 to 64, up in 26 states and D.C., and down in three.
- Ages 65 to 74, up in 25 states and down in two.
- Ages 75 and older, up in 36 states and down in none.
Note that as a result of the COVID-19 pandemic, Investopedia believes the labor force participation rate initially fell markedly in early 2020, from 63% to the 61.4% level as indicated above. The pandemic’s effect on the U.S. economy ended up discouraging workers from seeking employment in early 2020, as many businesses shut down and unemployment levels were high. The reality is COVID 19 is likely expanding a growing trend in the United States as Baby Boomers retire on time or even early due to the strains of COVID 19 in the workplace. Regions addressing this workforce challenge are likely to be attractive to companies seeking job retention and creation and capital investment.
Please contact Dave Robinson, Principal of the Montrose Group, LLC, a Columbus based economic development and public policy consulting firm, at [email protected] if the he can be of any assistance in an economic development or public policy matter.